This section assumes you have completed Tutorial Part3.
Compare viral loads
In part 3, we compared the viral counts between the two sample groups for Podoviridae, and it appeared as though group B had more viral sequence hits on average than group A. We can compare the normalised counts for these two groups to see if they're significantly different.
Student's T-test
Let's check out the dataframe we made earlier that we'll be using for the test:
print(podoCounts)
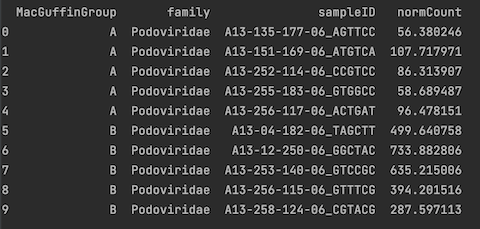
We'll use the python function stats.ttest_ind, which takes two vectors--one with the
group A counts and one with the group B counts.
We will first filter then group the data before using the t-test function. You'll also need to import the 'scipy.stats' library.
#add to top with the other import statements
import scipy.stats as stats

#filter
virusesFilteredA = viruses[(viruses.family=='Podoviridae') & (viruses.alnType=='aa') & (viruses.evalue<1e-10) & (viruses.MacGuffinGroup == 'A')]
virusesFilteredB = viruses[(viruses.family=='Podoviridae') & (viruses.alnType=='aa') & (viruses.evalue<1e-10) & (viruses.MacGuffinGroup == 'B')]

#group by
podoCountsA = virusesFilteredA.groupby(by=['family','sampleID'], as_index=False)['normCount'].agg('sum')
podoCountsB = virusesFilteredB.groupby(by=['family','sampleID'], as_index=False)['normCount'].agg('sum')

#two-sided test
df = len(podoCountsA) + len(podoCountsB) - 2
t_stat, p_val = stats.ttest_ind(podoCountsA.normCount, podoCountsB.normCount, equal_var=True)

print(f"t-test = {t_stat:.4f}", "\n",
          f"p-value = {p_val:.7f}", "\n",
          f"Degrees of Freedom = {df:.0f}")
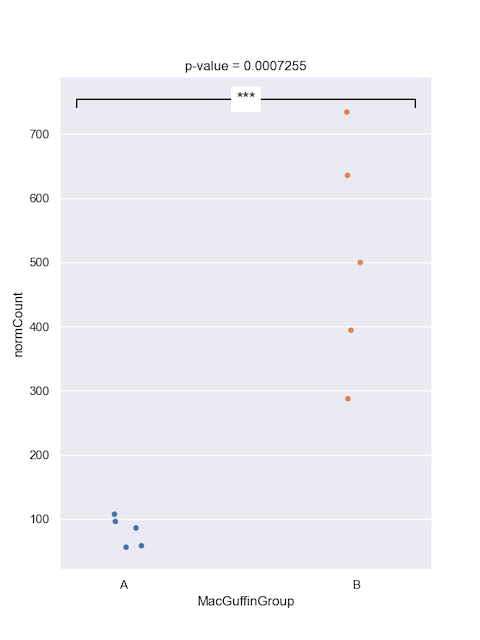
t-test = -5.3033
p-value = 0.0007255
Degrees of Freedom = 8
Below is example of how to plot the p-value significant notation manually onto graph
#plot
from matplotlib.markers import TICKDOWN

sns.set_style("darkgrid")
sns.set_palette("colorblind")
sns.set(rc={'figure.figsize':(6,8)})
ax = sns.stripplot(x="MacGuffinGroup",
                    y="normCount",
                    data=podoCounts, jitter=0.1)

#plot p-value
def significance_bar(start,end,height,displaystring,linewidth = 1.2,markersize = 8,boxpad  =0.3,fontsize = 15,color = 'k'):
    # draw a line with downticks at the ends
    plt.plot([start,end],[height]*2,'-',color = color,lw=linewidth,marker = TICKDOWN,markeredgewidth=linewidth,markersize = markersize)
    # draw the text with a bounding box covering up the line
    plt.text(0.5*(start+end),height,displaystring,ha = 'center',va='center',bbox=dict(facecolor='1.', edgecolor='none',boxstyle='Square,pad='+str(boxpad)),size = fontsize)

if p_val < 0.0001:
    pValAsterisk = '****'
elif p_val < 0.001:
  pValAsterisk = '***'
elif p_val < 0.01:
  pValAsterisk = '**'
elif p_val < 0.05:
  pValAsterisk = '*'
else:
  'ns'

height = podoCounts["normCount"].max()+20
significance_bar(-.2,1.25,height,pValAsterisk)
ax.set_title(f"p-value = {p_val:.7f}")
plt.show()
Wilcoxon test
You might prefer to perform a Wilcoxon test; the syntax is very similar to the t.test.
#Wilcoxon test
stat, p_val = stats.mannwhitneyu(x=podoCountsA.normCount, y=podoCountsB.normCount, alternative = 'two-sided')
print('Wilcoxon rank sum exact test')
print('Statistics=%.3f, p=%.6f' % (stat, p_val))
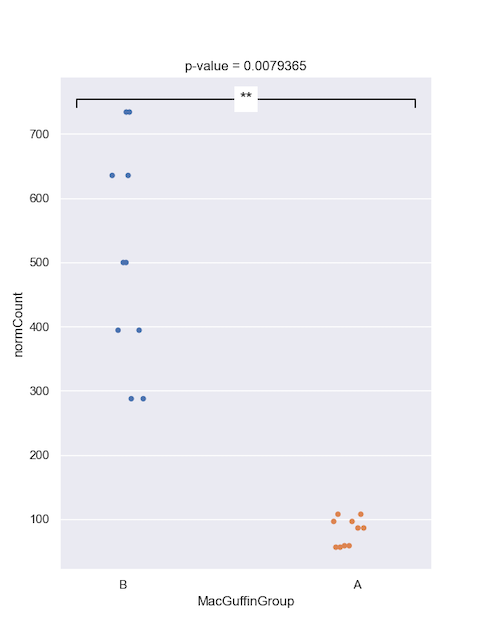
Wilcoxon rank sum exact test
Statistics=0.000, p=0.007937
Then plot
#plot
from matplotlib.markers import TICKDOWN

sns.set_style("darkgrid")
sns.set_palette("colorblind")
sns.set(rc={'figure.figsize':(6,8)})
ax = sns.stripplot(x="MacGuffinGroup",
                    y="normCount",
                    data=podoCounts, jitter=0.1)

#plot p-value
def significance_bar(start,end,height,displaystring,linewidth = 1.2,markersize = 8,boxpad  =0.3,fontsize = 15,color = 'k'):
    # draw a line with downticks at the ends
    plt.plot([start,end],[height]*2,'-',color = color,lw=linewidth,marker = TICKDOWN,markeredgewidth=linewidth,markersize = markersize)
    # draw the text with a bounding box covering up the line
    plt.text(0.5*(start+end),height,displaystring,ha = 'center',va='center',bbox=dict(facecolor='1.', edgecolor='none',boxstyle='Square,pad='+str(boxpad)),size = fontsize)

if p_val < 0.0001:
    pValAsterisk = '****'
elif p_val < 0.001:
  pValAsterisk = '***'
elif p_val < 0.01:
  pValAsterisk = '**'
elif p_val < 0.05:
  pValAsterisk = '*'
else:
  'ns'

height = podoCounts["normCount"].max()+20
significance_bar(-.2,1.25,height,pValAsterisk)
ax.set_title(f"p-value = {p_val:.7f}")
plt.show()
Dunn's test
Let's use Dunn's test to check all the major families at the same time. Dunn's is good for if you have three or more categories for a metadata field, such as our vaccine column. First find out what the major families are by summing the hits for each family and sorting the table.
#filter
virusesFiltered = viruses[(viruses.alnType=='aa') & (viruses.evalue<1e-10)]

#group by
viralFamCounts = virusesFiltered.groupby(by=['family'], as_index=False)['normCount'].agg('sum')
viralFamCounts = viralFamCounts.sort_values(by=['normCount'])

# plot
sns.set_style("darkgrid")
sns.set_palette("colorblind")
sns.set(rc={'figure.figsize':(12,8)})
sns.barplot(x="normCount", y="family", data=viralFamCounts)
plt.subplots_adjust(left=0.2)
plt.grid(True)
plt.show()
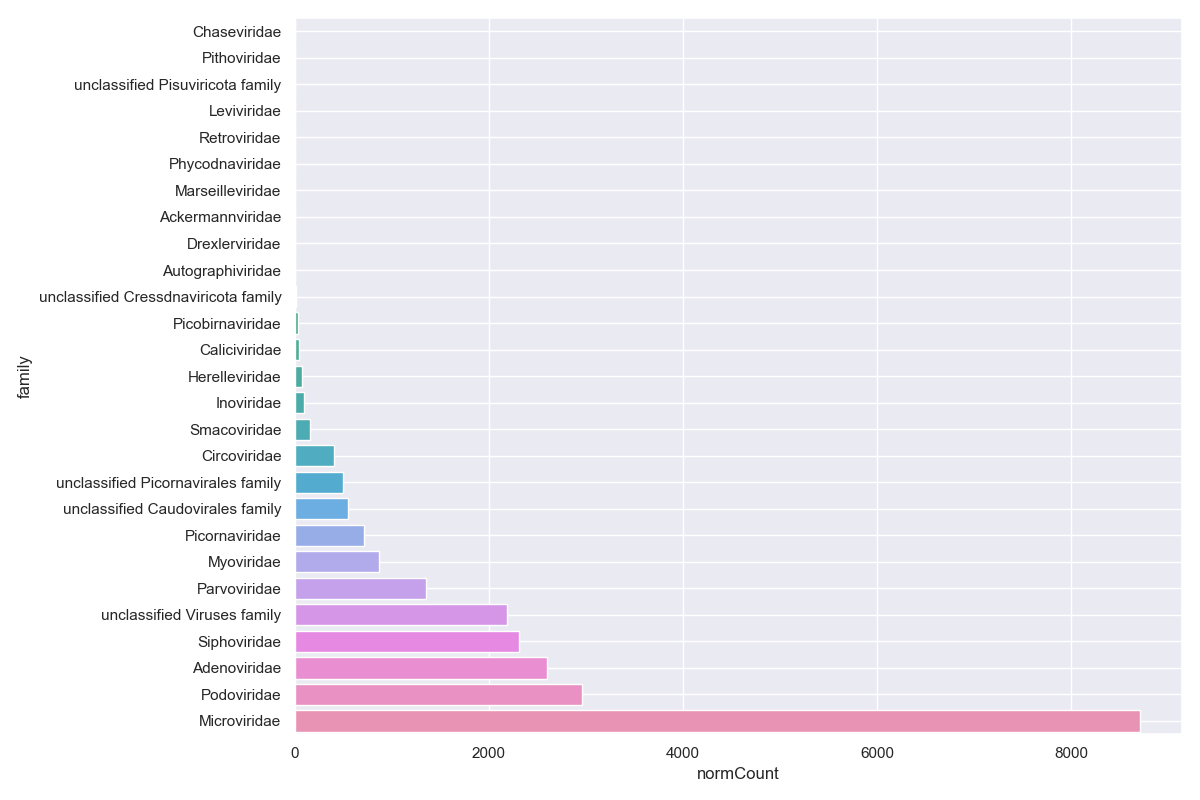
Let's focus on Siphoviridae, Adenoviridae, Podoviridae, and Microviridae. Collect summary counts for these families for each sample and include the metadata we want to use:
# filter out all but top families
virusesFiltered = viruses[(viruses['family'].isin(['Siphoviridae','Adenoviridae','Podoviridae','Microviridae'])) & (viruses.alnType=='aa') & (viruses.evalue<1e-10)]

# group and collect the counts
viralMajorFamCounts = virusesFiltered.groupby(by=['family','vaccine','sampleID'], as_index=False).sum('normCount')

# Dunn's test on Siphoviridae
from scikit_posthocs import posthoc_dunn
posthoc_dunn(viralMajorFamCounts[viralMajorFamCounts['family']=='Siphoviridae'], val_col = 'normCount', group_col = 'vaccine')
            Ad_alone  Ad_protein      sham
Ad_alone    1.000000    0.017142  0.242908
Ad_protein  0.017142    1.000000  0.152661
sham        0.242908    0.152661  1.000000
# Use a loop to run Dunn's test on all families
for i in viralMajorFamCounts['family'].unique():
    print(i)
    print(posthoc_dunn(viralMajorFamCounts[viralMajorFamCounts['family']==i], val_col = 'normCount', group_col = 'vaccine'))
    print('\n')
Adenoviridae
            Ad_alone  Ad_protein      sham
Ad_alone    1.000000    0.640738  0.661205
Ad_protein  0.640738    1.000000  0.916051
sham        0.661205    0.916051  1.000000

Microviridae
            Ad_alone  Ad_protein      sham
Ad_alone    1.000000    0.181926  0.350201
Ad_protein  0.181926    1.000000  0.567269
sham        0.350201    0.567269  1.000000

Podoviridae
            Ad_alone  Ad_protein      sham
Ad_alone    1.000000    0.633553  0.079839
Ad_protein  0.633553    1.000000  0.340356
sham        0.079839    0.340356  1.000000

Siphoviridae
            Ad_alone  Ad_protein      sham
Ad_alone    1.000000    0.017142  0.242908
Ad_protein  0.017142    1.000000  0.152661
sham        0.242908    0.152661  1.000000
We can then plot any interesting or significant differences like we did above for the Student's t-test or the Wilcoxon test.
Compare presence/absence
You might not care about viral loads and instead are just interested in comparing the presence or absence of viruses. For this you could use a Fisher's exact test. To perform this test you need to assign a presence '1' or absence '0' for each viral family/genus/etc for each sample. What number of hits you use for deciding if a virus is present is up to you.
I want to be sure about the alignments, so I'll apply some stringent filtering cutoffs. Then I'll assign anything with any hits as 'present' for that viral family. Let's look at Myoviridae ... for no particular reason.
#filter
virusesFiltered = viruses[(viruses.family=='Myoviridae') & (viruses.alnType=='aa') & (viruses.evalue<1e-30) & (viruses.alnlen>150) & (viruses.pident>75)]

#group by
myovirPresAbs = virusesFiltered.groupby(by=['sampleID'], as_index=False, dropna=False)['normCount'].agg('sum')
myovirPresAbs = pd.merge(myovirPresAbs, meta, on=["sampleID"], how="outer")
myovirPresAbs["normCount"].fillna(0, inplace = True)
myovirPresAbs = myovirPresAbs.assign(present = np.where((myovirPresAbs.normCount>0),1,0))
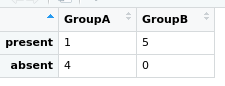
To do the Fisher's exact test we need to specify a 2x2 grid; The first column will be the number with Myoviridae for each group. The second column will be the numbers without for each group.
# matrix rows
#count of rows
mtxGroupAPresentCount = len(myovirPresAbs[(myovirPresAbs.MacGuffinGroup=='A') & (myovirPresAbs.present == 1)])
mtxGroupAAbsentCount = len(myovirPresAbs[(myovirPresAbs.MacGuffinGroup=='A') & (myovirPresAbs.present == 0)])
mtxGroupBPresentCount = len(myovirPresAbs[(myovirPresAbs.MacGuffinGroup=='B') & (myovirPresAbs.present == 1)])
mtxGroupBAbsentCount = len(myovirPresAbs[(myovirPresAbs.MacGuffinGroup=='B') & (myovirPresAbs.present == 0)])

#create matrix table
myovirFishMtx = np.array([[mtxGroupAPresentCount, mtxGroupAAbsentCount], [mtxGroupBPresentCount, mtxGroupBAbsentCount]])
#Run Fisher's exact test
oddsr, p = stats.fisher_exact(myovirFishMtx)
print('Run Fishers exact test')
print('odds ratio=%.0f, p-value=%.5f' % (oddsr, p))
Fisher's Exact Test for Count Data
odds ratio=0, p-value=0.04762
Alternative hypothesis: true odds ratio is not equal to 1
We don't have many samples, so our significance won't be great regardless.
In Part 5 we will look at the contigs' read-based annotations.